
Operations intelligence for fairs & live events
Better visibility.
Better decisions.
Better fair operations.
FairOS: Audit brings Concessions into view—from daily source sales to booth comparisons and mapped 15-minute activity. See where sales happen and how activity changes through the day.
Built for fair operations
Fair operations create enormous amounts of data. FairOS helps you use it.
Explore Concessions booth comparisons, day and hour views, and mapped activity. Admissions, parking, bars, settlement and broader Management views are in development.
Bring Concessions reports into context by booth, time and location.
Flagship product
FairOS: Audit
See what happened. Understand why.
Know where to look next.
Audit helps fairs examine Concessions sales in context—by booth, time and location.
Concessions overview
Cedar Vale Fair · Day 9
Fictional demo — not audited / not posted. Daily totals cover Day 9; the map shows four selected intervals.
Review day and hour views
Compare Concessions sales and daily transaction totals.
Compare what matters
Compare booth performance and year-over-year activity by event day-number.
See activity on the grounds
Explore booth activity across the fairgrounds in 15-minute intervals.
Sales Over Time
Review when and where sales activity changed.
Explore 72 Cedar Vale Concessions booths and follow sales activity through four Day 9 intervals.
Cedar Vale Fairgrounds Map
Cedar Vale · Fictional demo data · Day 9
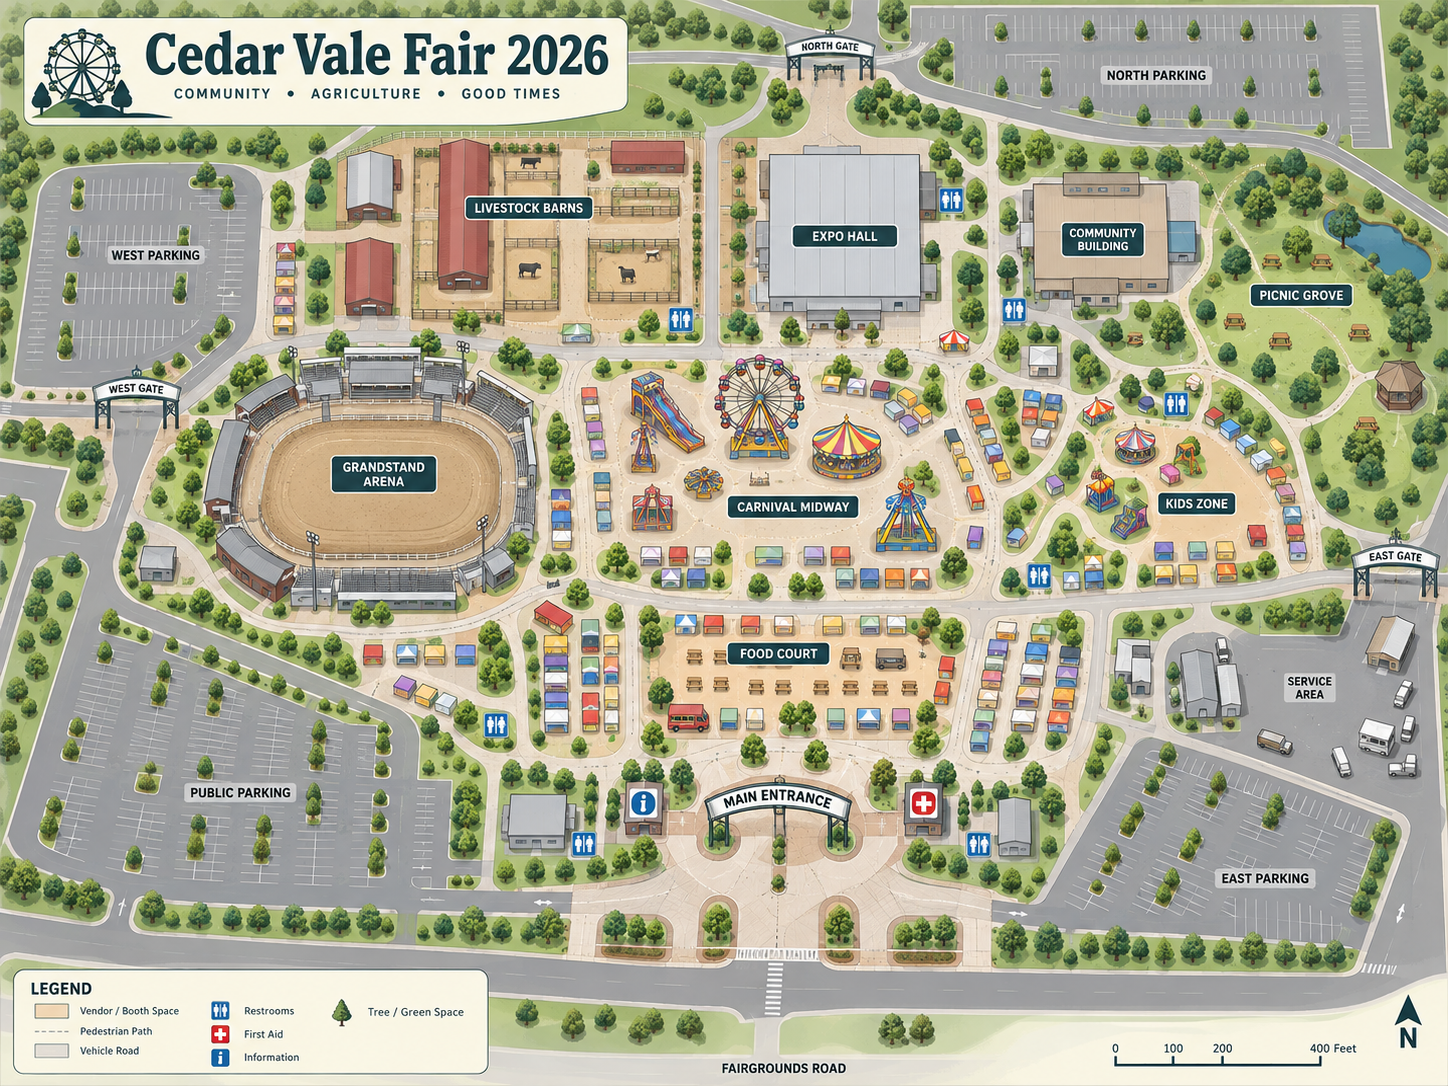
Concessions · 72 placed with data · 1:15–1:30 PM
Darker blue means higher booth gross within the selected interval. Missing reports are shown as unknown.
This interactive preview uses recorded fictional demo data, not a live feed or audited results. Activity is shown in 15-minute intervals.
Operations intelligence
The numbers are only useful if they tell you where to look.
Compare booths and activity across the grounds to find the patterns that matter to your team.
Which booths lead in Day 9 source gross?
How does Concessions activity vary by day-number?
Where is source sales activity concentrated?
How does mapped activity change between intervals?
Source gross is before discounts, refunds, tax and tips. These four booths are part of the 72 reporting booths, not the full daily total.
Built by fair operators
Built inside the fair industry.
FairOS grew from operational problems encountered while running fairs and major events. The software follows how fairgrounds actually work—not how generic retail systems assume they work.
Grounded in the realities of multi-day events, temporary locations, independent vendors, changing weather, and complex reporting.
A clearer view of your operation
See what your fair has been missing.
Discover how FairOS can give your team better visibility into your operation.